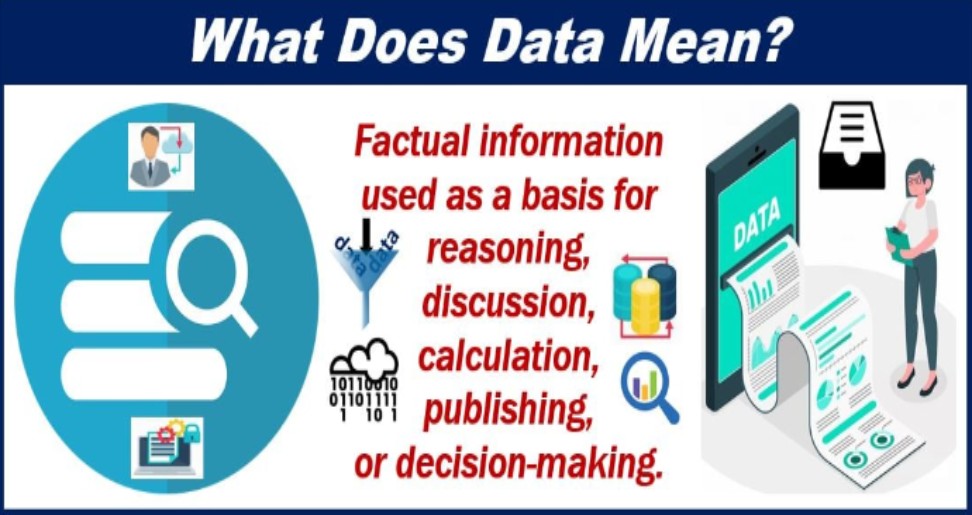
Data, in its most basic form, is raw, unorganized facts and figures. It’s the foundation upon which information is built. From simple numbers to complex datasets, data is ubiquitous in our world. Let’s delve into various examples of data across different domains.
Quantitative and qualitative data
Data, the raw material of information, can be categorized into two primary types: quantitative and qualitative.
Quantitative Data
Quantitative data, as the name suggests, is numerical.
It is data that can be counted or measured. This type of data is often used in statistical analysis to identify patterns, trends, and correlations.
Key characteristics of quantitative data:
- Numerical: Expressed in numbers, such as counts, percentages, or measurements.
- Objective: Based on facts and figures, free from personal interpretation.
- Measurable: Can be quantified using specific units.
- Statistical analysis: Suitable for statistical methods like mean, median, mode, standard deviation, etc.
Examples of quantitative data:
- Number of students in a class
- Height and weight measurements
- Sales figures
- Income levels
- Temperature readings
Qualitative Data

Qualitative data, on the other hand, is descriptive.
It focuses on understanding the qualities or characteristics of something rather than measuring it numerically. This type of data provides insights into people’s thoughts, opinions, and experiences.
Key characteristics of qualitative data:
- Descriptive: Expressed in words, images, or observations.
- Subjective: Based on interpretations and perspectives.
- Contextual: Provides rich context and depth of understanding.
- Thematic analysis: Often analyzed by identifying themes and patterns.
Examples of qualitative data:
- Interview transcripts
- Open-ended survey responses
- Observation notes
- Customer feedback
- Case studies
Relationship Between Quantitative and Qualitative Data

While quantitative and qualitative data are distinct, they can complement each other in research.
Often, researchers combine both types of data to gain a comprehensive understanding of a phenomenon. For example, a study on customer satisfaction might include quantitative data on customer ratings and qualitative data from customer interviews to explore the reasons behind those ratings.
Etymology
is the captivating exploration of a word’s historical journey. It delves into the origins of language, tracing words back to their earliest known forms and meanings. By dissecting words into their constituent parts, etymologists unravel the intricate tapestry of linguistic evolution, revealing how languages borrow, adapt, and transform over time. This discipline illuminates the interconnectedness of cultures and the fascinating stories embedded within the simplest of terms, offering a unique perspective on the world around us.
Data Security
Data security is the comprehensive practice of safeguarding digital information from unauthorized access, corruption, destruction, modification, theft, or disclosure throughout its entire lifecycle.
This encompasses a multifaceted approach, including the physical protection of hardware and storage devices, the logical security of software applications, and the implementation of robust administrative and access controls. By employing a combination of technological measures, such as encryption and data masking, and organizational policies, businesses can effectively mitigate risks, protect sensitive information, and maintain compliance with industry regulations. Ultimately, data security is essential for preserving the integrity, confidentiality, and availability of valuable assets in today’s digital landscape.
Data Privacy
Data Privacy is the fundamental right of individuals to control their personal information.
It encompasses the ability to determine how, when, and to what extent personal data is collected, stored, used, and shared. This includes information such as names, addresses, contact details, financial records, and online behavior. In essence, data privacy ensures that individuals have agency over their digital footprint, safeguarding it from unauthorized access, misuse, or disclosure.
Data Integrity
Data integrity refers to the accuracy, completeness, consistency, and trustworthiness of data over its entire lifecycle. It ensures that data remains unaltered and free from corruption during collection, storage, processing, transmission, and use. Maintaining data integrity is crucial for informed decision-making, as errors or inconsistencies can lead to incorrect conclusions. This is achieved through various methods such as data validation, error detection and correction codes, access controls, and regular data backups. By safeguarding data integrity, organizations can protect their reputation, comply with regulations, and optimize their operations.
Data Management

Data management is the comprehensive practice of collecting, organizing, storing, protecting, and utilizing an organization’s data as a valuable asset.
It encompasses a range of disciplines aimed at ensuring data is accessible, reliable, and secure for informed decision-making. By effectively managing data, organizations can optimize operations, uncover valuable insights, and maintain compliance with relevant regulations. This involves establishing robust data governance frameworks, implementing data quality standards, and leveraging advanced technologies to manage the increasing volume and complexity of data. Ultimately, data management is essential for driving innovation, improving efficiency, and gaining a competitive edge in today’s data-driven world.
Data Processing
Data processing is the systematic transformation of raw data into meaningful information.
This intricate process involves collecting data from diverse sources, cleaning it to remove inconsistencies or errors, and organizing it into a structured format. Once prepared, the data undergoes analysis to extract valuable insights and patterns. These insights are then interpreted and presented in a comprehensible manner, often through visualizations, reports, or summaries. Data processing is the backbone of modern decision-making, empowering businesses and organizations to make informed choices based on reliable information.
Data Collection
Data collection is the systematic process of gathering and recording information or measurements. This crucial step in research, analysis, and decision-making involves defining clear objectives, selecting appropriate methods (surveys, interviews, observations, experiments, etc.), and meticulously collecting relevant data. The quality of data collected directly impacts the reliability and validity of subsequent analyses, making it essential to implement robust data management practices to ensure accuracy, completeness, and security.
Data Visualization
Data Visualization is the art and science of translating complex data into visual representations that are easily understandable and informative.
By employing a variety of graphical elements such as charts, graphs, maps, and infographics, data visualization transforms raw data into actionable insights. This process empowers individuals to quickly identify patterns, trends, and outliers that might otherwise be obscured in numerical form. Effective data visualization not only enhances comprehension but also facilitates effective communication of findings to diverse audiences, whether they are technical experts or general consumers. Ultimately, it serves as a powerful tool for decision-making, problem-solving, and storytelling with data.
Data Storytelling
Data storytelling is the art of transforming raw data into a compelling narrative that resonates with an audience.
It involves extracting meaningful insights from complex datasets, crafting a coherent story around those insights, and effectively communicating them through visuals and language. By weaving data into a narrative, data storytelling makes complex information accessible and understandable, fostering engagement and driving action. It’s more than just presenting numbers; it’s about revealing the story hidden within the data, connecting with emotions, and inspiring change.
Numerical Data

Numerical data, as the name suggests, consists of numbers. It can be discrete (whole numbers) or continuous (decimal numbers).
- Discrete Data:
- Number of students in a class
- Number of cars in a parking lot
- Number of houses in a city
- Continuous Data:
- Height of a person
- Weight of an object
- Temperature measurement
Categorical Data
Categorical data represents qualities or characteristics. It’s descriptive rather than numerical.
- Nominal Data:
- Gender (male, female, other)
- Eye color (blue, brown, green)
- Marital status (single, married, divorced)
- Ordinal Data:
- Educational level (high school, bachelor’s, master’s, PhD)
- Satisfaction level (very satisfied, satisfied, neutral, dissatisfied, very dissatisfied)
- Product rating (1 star, 2 stars, 3 stars, 4 stars, 5 stars)
Textual Data
Textual data is information represented in text format. It can be structured or unstructured.
- Structured Text Data:
- Addresses
- Product descriptions
- Social security numbers
- Unstructured Text Data:
- Emails
- Social media posts
- News articles
Image Data
Image data represents visual information. It’s typically stored as a matrix of pixels.
- Photographs:
- People, objects, landscapes
- Medical Images:
- X-rays, MRIs, CT scans
- Satellite Imagery:
- Land use, weather patterns
Audio Data
Audio data captures sound waves. It’s often represented as a digital signal.
- Speech:
- Human voice recordings
- Music:
- Songs, soundtracks
- Environmental Sounds:
- Bird chirping, ocean waves
Video Data
Video data combines image and audio data to create moving visual content.
- Movies:
- Feature films, documentaries
- TV Shows:
- Dramas, comedies, reality shows
- Surveillance Footage:
- Security cameras
Financial Data
Financial data relates to monetary transactions and market information.
- Stock Prices:
- Opening, closing, high, low prices
- Sales Figures:
- Revenue, profit, cost
- Credit Scores:
- Individual or business creditworthiness
Geographic Data
Geographic data represents spatial information. It includes location, shape, and size of features.
- Maps:
- Road networks, land use, population density
- GPS Coordinates:
- Latitude and longitude of a location
- Weather Data:
- Temperature, precipitation, wind speed by location
Healthcare Data
Healthcare data pertains to patient information, medical records, and health outcomes.
- Patient Demographics:
- Age, gender, address
- Medical History:
- Diagnoses, treatments, medications
- Lab Results:
- Blood tests, X-ray reports
Read More :
Featured Image Source: https://tinyurl.com/5afjepfw